When data tells us the what but not the why
Topic: Adoption, Corporate parenting, Foster care, Kinship care, Looked after at home, Neglect, Permanence, Residential care
Author: Micky Anderson


The publication of the latest Children’s Social Work Statistics 2022-23 ‘Looked After Children’ data at the end of last month (April 2024) should provide us with a picture of what’s happening for children.
The headline tells us that the number of children going into care is falling. However, this data provides only an outline drawing. For me, the details are missing: the picture is an incomplete sketch without the features or colours to complete our understanding.
On the face of it, the number of children going into care is one of the more dynamic indicators that should be responsive to changes in policy and practice, so it is of course tempting to look to this indicator for evidence as to whether the aims of The Promise of the Independent Care Review are being met or not.
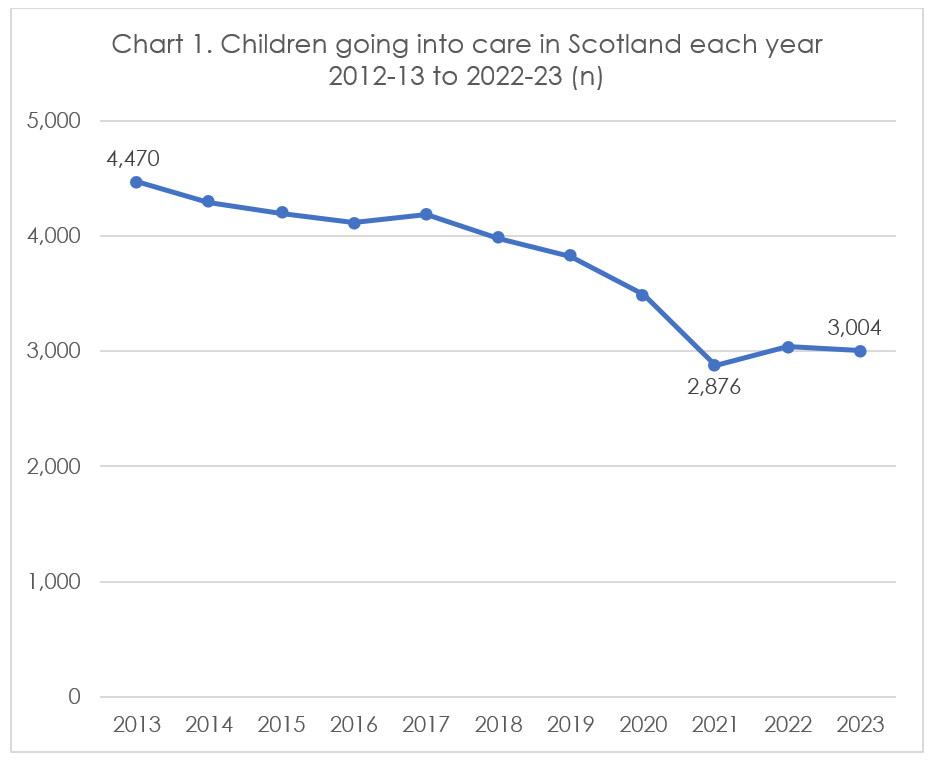
A clear aim articulated in The Promise is that effective support for families should reduce the need for children to go into care, and a cursory look at the data shows that the number of children going into care in Scotland began to fall almost immediately after publication of The Promise in February 2020, with the latest figure for 2022-23 over 20% down on the 2018-19 figure. Is this what an immediate impact looks like? Unfortunately not - I’m sure you’re ahead of me in recognising that there’s an elephant is the room here: which is the small matter of the COVID-19 pandemic that began in 2020, and the effect of public health restrictions on the lives of our children and families and the services to support them.
The pandemic certainly demonstrated that the number of children going into care can be a highly responsive to wider circumstances: there was a 39% drop in the months after the pandemic started, and a massive 79% reduction in the number of children ‘looked after’ at home during this period. This step-change can also be seen in the 2020 and 2022 national data (chart 1):

Looking at this data over this ten year period, of most immediate interest is that the latest 2022-23 figure shows that there has been no bounce-back to pre-pandemic levels of children going into care. Given what we know about care and support and the assumptions that were made, this would appear to be counter-intuitive. The pandemic put families under significant additional pressure without the usual support, so it might have been expected that we’d see the manifestation of deferred need for care and protection once support was more accessible again. How then can we explain the continuing lower level of children going into care?
This is where a headline official statistic has frustrating limitations; it can’t, for example, tell us if the need for care and protection has changed, or if there is unmet need, or if thresholds for escalation have changed, nor if barriers that prevent access to services persist. It can’t tell us if some issues that would previously have resulted a child needing the support of care have resolved themselves without intervention, nor indeed if improved support for families is leading to more children being able to stay with their families. This highlights the difficulty in attributing observed change to policy and subsequent practice interventions when there are multiple chains of cause and effect at play at the same time. Changes to support for families can undoubtedly contribute to better outcomes, in this case more families staying together, but attribution of change in a complex environment where many other factors also have an impact is much more of a challenge, even without a game-changer such as the pandemic.
The Promise Plan 21-24 acknowledges the limitations of this indicator and the difficulty in determining what is going on “in reality” behind the reduction in children and young people going into care, so can the latest data tell us anything more about these children?

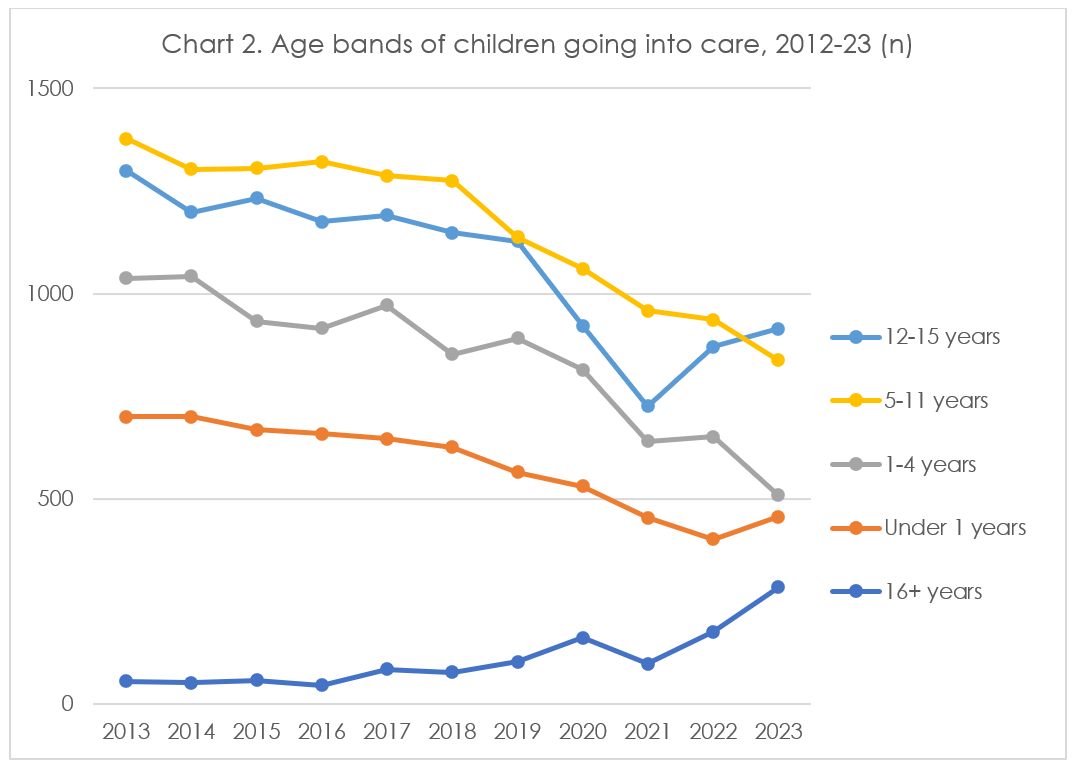
We can see that change over the last ten years has not been consistent across age groups. There’s a marked increase for children aged 12-15 and those aged 16+ since 2021, with those aged 16+ making up a much higher proportion of children going into care in the latest year compared to 2013 (1% to 9%). We also see that the number of babies going into care increased in the latest year, ending a sustained downward trend, whereas the number of young children aged 1-4 and the number of 5-11 year-olds have both fallen. Why are we seeing more older children and less younger children going into care? The data gives us very little to go on in terms of the reasons behind these changes, leaving us to speculate and draw upon information from other sources. For example, to what extent is the increase in older children explained by children who are refugees or are seeking asylum going into care to receive support?

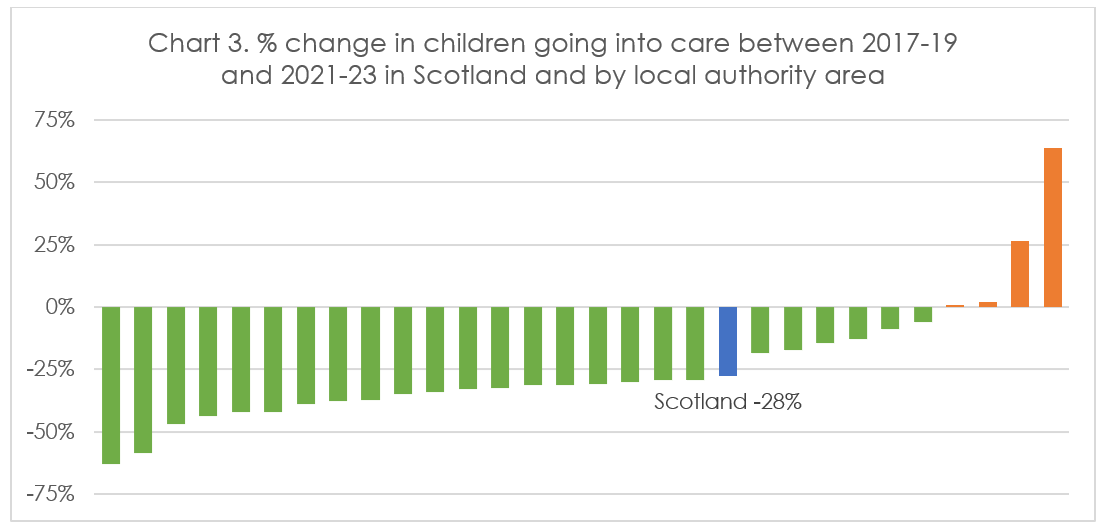
When we look at the percentage difference between the number of children going into care in the two reporting years before the pandemic (2017-19) and the two most recent years (2021-23) across local authority areas, (excepting the island authorities because of small numbers) most areas have seen a substantial reduction, and across Scotland as a whole there was a 28% reduction.
The publication of more of the data already collected won’t answer the big questions but sharing some of this would be helpful. The ‘vulnerable children data collection’ that started during the pandemic identifies the number of children going into care at home from those being supported by care away from home. It would be useful to have further information in the annual publication, such as the type of care arrangement and the legal reason used behind the need for and provision of care. These are already provided for the annual snapshot of all children currently in care, rather than for children going into care during each year.
While it is not without complications, a general shift to more explanatory and experiential data collection would help us begin to answer some of the questions the data raises. For example it would be helpful to know the reasons that lead to children going into care so that we can shape, develop, plan and provide the support that children, young people and their families most need.
If more families receive the support they need, it’s not unreasonable to expect that the number of children going into care would, and should, reduce, but we need to consider that wider circumstances and factors can also affect families and their resilience, and recognise the difficulty in disentangling the impact of one or more components in a complex environment. We simply cannot know based on this data alone.
The views expressed in this blog post are those of the author/s and may not represent the views or opinions of our funders.
Commenting on the blog posts: sharing comments and perspectives prompted by the posts on this blog are welcome.
CELCIS operates a moderation process so your comment will not go live straight away.


